


Model Architecture
Ensemble of gradient boosters, temporal transformers, and state-space models.
ŷt+h = ∑m wm · fm(Xt-h:t) + εtStonewell One turns market data into probabilities, drivers,
and validation records — so you can see what the model sees
and where uncertainty remains in one place.
The Market Signal Before the Story.
Methodology at a Glance
1. Data
Multi-asset, alternative & on-chain datasets.
2. Models
Ensemble of statistical, ML & macro models.
3. Probabilities
Bayesian framework quantifies outcomes.
4. Decisions
Clear insights. Measurable edge.
Transparent. Probabilistic. Built for real decisions.
We don't predict the future. We quantify it.Inside the Terminal

Forecast Summary (10d)
Methodology
Ensemble of gradient boosters, temporal transformers, and state-space models.
ŷt+h = ∑m wm · fm(Xt-h:t) + εt140+ engineered factors across price, volume, options, macro and alt data.
Walk-forward validation, out-of-sample checks, calibration scorecards, and rolling equity curves.
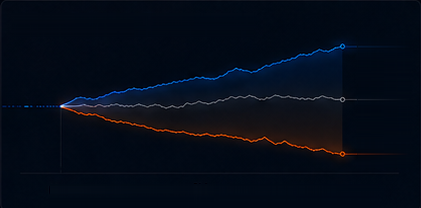
Rolling Equity Curve (Out-of-Sample)
Coverage: Equities + Crypto →Versioned releases with change logs, audit trail, and notes for what changed and why.
The Proof Chain
Open the Forecast
90-day calibration E90 78%E50 93%
Live Operations
FAQ
Open Access
$ stonewellone --init
✓ auth verified
✓ models synced (5)
✓ regime detected (trend ↗)
✓ calibration loaded
✓ terminal ready
→ opening /predictions/live

